Figure 10-5 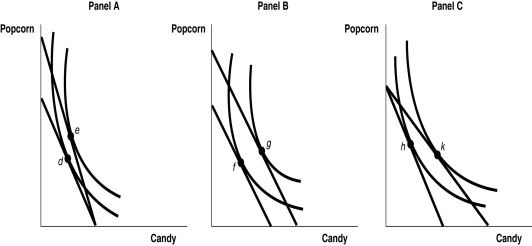
-Refer to Figure 10-5.Which diagram demonstrates an increase in total utility following a decrease in the price of popcorn?
A) the movement from d to e in Panel A
B) the movement from f to g in Panel B
C) the movement from h to k in Panel C
D) none of the above
Correct Answer:
Verified
Q140: Figure 10-4 Q141: Figure 10-6 Q144: Figure 10-6 Q255: The slope of an indifference curve Q259: If preferences are transitive, indifference curves Q265: Aisha and Debbie both purchase milk and Q265: Suppose the consumer's income increases while the Q281: The marginal rate of substitution is determined Q281: A consumer's utility-maximizing combination of goods is Q296: Gowri has $6 per day to purchase Unlock this Answer For Free Now! View this answer and more for free by performing one of the following actions Scan the QR code to install the App and get 2 free unlocks Unlock quizzes for free by uploading documents![]()
![]()
![]()
A)is calculated
A)intersect at

