Figure 3-8 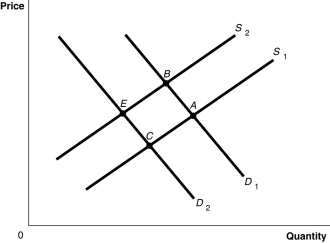
-Refer to Figure 3-8.The graph in this figure illustrates an initial competitive equilibrium in the market for apples at the intersection of D1 and S2 (point B) ) Which of the following changes would cause the equilibrium to change to point C?
A) A positive change in the technology used to produce apples and decrease in the price of oranges, a substitute for apples.
B) An increase in the wages of apple workers and an increase in the price of oranges, a substitute for apples.
C) An increase in the number of apple producers and a decrease in the number of apple trees as a result of disease.
D) A decrease in the wages of apple workers and an increase in the price of oranges, a substitute for apples.
Correct Answer:
Verified
Q208: Which of the following would cause an
Q212: All else equal,the decrease in consumer preference
Q215: If more insurance companies decide to cover
Q215: The cost of raising beef cattle has
Q216: Figure 3-8 Q217: A decrease in the equilibrium price for Q220: Blu-ray players were introduced to the market Q228: If the number of firms producing mouthwash Q392: Article Summary Q393: Figure 3-8 ![]()
A growing number of U.S. citizens![]()
Unlock this Answer For Free Now!
View this answer and more for free by performing one of the following actions

Scan the QR code to install the App and get 2 free unlocks

Unlock quizzes for free by uploading documents