Figure 18-3 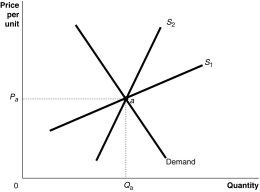
-Refer to Figure 18-3.The figure above shows a demand curve and two supply curves,one more elastic than the other.Use Figure 18-3 to answer the following questions.
a.Suppose the government imposes an excise tax of $1.00 on every unit sold.Use the graph to illustrate the impact of this tax.
b.If the government imposes an excise tax of $1.00 on every unit sold,will the consumer pay more of the tax if the supply curve is S1 or S2? Refer to the graphs in your answer.
c.If an excise tax of $1.00 on every unit sold is imposed,will the revenue collected by the government be greater if the supply curve is S1 or S2?
d.If the government imposes an excise tax of $1.00 on every unit sold,will the deadweight loss be greater if the supply curve is S1 or S2?
Correct Answer:
Verified
View Answer
Unlock this answer now
Get Access to more Verified Answers free of charge
Q206: Figure 18-4 Q214: Article Summary Q215: Article Summary Q220: What is the United States government's formal Q221: In the United States Q222: A Gini coefficient of _ means that Q225: As a group, people with high incomes Q228: Which of the following groups had the Q230: The Gini coefficient for the United States Q239: Figure 18-7
![]()
In 2012, Colorado and Washington legalized
In 2012, Colorado and Washington legalized
A)the income tax system
![]()
Unlock this Answer For Free Now!
View this answer and more for free by performing one of the following actions

Scan the QR code to install the App and get 2 free unlocks

Unlock quizzes for free by uploading documents