The graph below shows the relative changes in concentration of glucose,fatty acids,and ketone bodies during 40 days of starvation.Choose the answer that correctly labels the data on the graph. 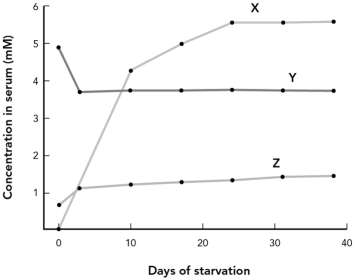
A) X = fatty acids; Y = glucose; Z = ketone bodies
B) X = glucose; Y = fatty acids; Z = ketone bodies
C) X = ketone bodies; Y = glucose; Z = fatty acids
D) X = ketone bodies; Y = fatty acids; Z = glucose
Correct Answer:
Verified
Q24: PPARs have a variety of functions in
Q25: What might occur if a mutation in
Q26: Leptin is a
A) mutated form of insulin.
B)
Q27: During periods of starvation,gluconeogenesis increases in the
Q28: A lack of energy balance may lead
Q30: Which of the following neurons is a
Q31: The average amount of adipose tissue the
Q32: Which of the following is NOT one
Q33: Thrifty genes are _ during times of
Q34: Enzyme activities after PPAR signaling were monitored
Unlock this Answer For Free Now!
View this answer and more for free by performing one of the following actions

Scan the QR code to install the App and get 2 free unlocks

Unlock quizzes for free by uploading documents