Figure 3-1 shows the shifts in the demand curve for a good. Using the graph and beginning on D1, a shift to D0 would indicate a(n) :Figure 3-1 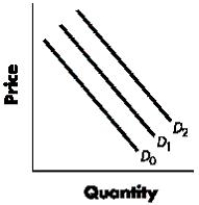
A) increase in demand.
B) decrease in demand.
C) increase in quantity demanded.
D) decrease in quantity demanded.
E) increase in the price of the good.
Correct Answer:
Verified
Q28: A decrease in quantity demanded:
A)is illustrated by
Q29: An increase in quantity demanded:
A)is illustrated by
Q30: Which of the following is true of
Q31: In economics, the demand for a good
Q32: An increase in the price of a
Q34: A decrease in demand for a good
Q35: When quantity demanded increases at every possible
Q36: Two goods are substitutes when a decrease
Q37: When quantity demanded decreases at every possible
Q38: Table 3-1 shows the demand schedules for
Unlock this Answer For Free Now!
View this answer and more for free by performing one of the following actions

Scan the QR code to install the App and get 2 free unlocks

Unlock quizzes for free by uploading documents