Table 3-3 shows the market demand and market supply schedules for large pepperoni pizzas. In the given illustration, the equilibrium price per large pepperoni pizza is: 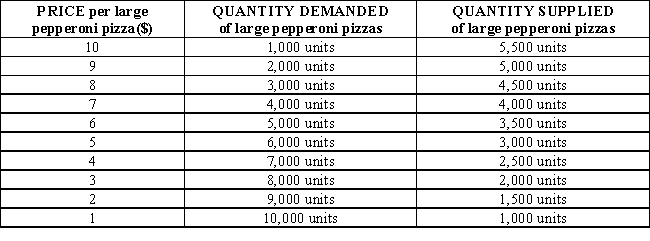
A) $9.
B) $8.
C) $7.
D) $6.
E) $5.
Correct Answer:
Verified
Q68: A technological improvement that lowers production costs
Q69: Figure 3-4 represents the market for butter.
Q70: What is the most likely effect of
Q71: Table 3-3 shows the market demand and
Q72: A technological advancement in recycling made it
Q74: If roses are currently selling for $30
Q75: When there is an excess quantity demanded
Q76: Which of the following would shift a
Q77: The supply curve for a good will
Q78: Which of the following is true of
Unlock this Answer For Free Now!
View this answer and more for free by performing one of the following actions

Scan the QR code to install the App and get 2 free unlocks

Unlock quizzes for free by uploading documents