Figure 3-4 represents the market for butter. If the current price of butter equals $2 per pound, then:Figure 3-4 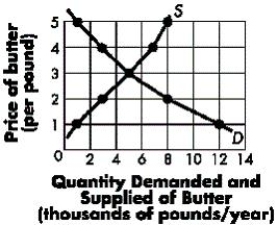
A) the market is in equilibrium at 3,000 pounds per year.
B) the market is in equilibrium at 8,000 pounds per year.
C) the market is not in equilibrium and the quantity supplied is greater than the quantity demanded.
D) the market is not in equilibrium and the quantity demanded is greater than the quantity supplied.
E) the market is in equilibrium at 6,000 pounds of butter per year.
Correct Answer:
Verified
Q76: Which of the following would shift a
Q77: The supply curve for a good will
Q78: Which of the following is true of
Q79: Table 3-4 shows the market demand and
Q80: Which of the following would cause the
Q82: Figure 3-4 represents the market for butter.
Q83: Figure 3-4 represents the market for butter.
Q84: If the market price of a good
Q227: How does the equilibrium quantity change when
Q250: Serious natural disasters like hurricanes and tornadoes
Unlock this Answer For Free Now!
View this answer and more for free by performing one of the following actions

Scan the QR code to install the App and get 2 free unlocks

Unlock quizzes for free by uploading documents