Graph A below shows an elastic demand curve, and Graph B shows an inelastic demand curve. With reference to Graph A, at a price of $20, total revenue equals _____.Figure 4.1: 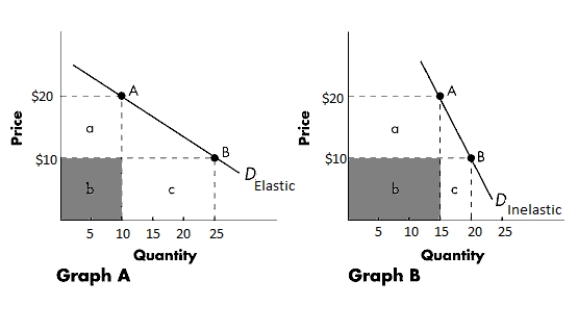
A) $400
B) $200
C) $500
D) $1,000
E) $100
Correct Answer:
Verified
Q38: At Bailey's Barber Shop, a 5 percent
Q39: If recent sharp increases in the price
Q40: A steel mill raises the price of
Q41: If the demand for a good is
Q42: Graph A below shows an elastic demand
Q44: When the local symphony recently raised the
Q45: The following table shows Kate's demand for
Q46: A jeweler cut prices in his store
Q47: If the short-run elasticity of demand for
Q48: When the price of ulcer medication increased
Unlock this Answer For Free Now!
View this answer and more for free by performing one of the following actions

Scan the QR code to install the App and get 2 free unlocks

Unlock quizzes for free by uploading documents