Graph A below shows an elastic demand curve, and Graph B shows an inelastic demand curve. Graph A shows that as the price decreases from $20 to $10, total revenue _____ and quantity demanded _____.Figure 4.1: 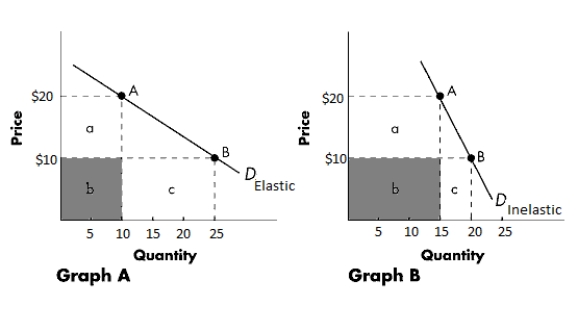
A) decreases; increases
B) decreases; decreases
C) increases; increases
D) increases; decreases
E) remains unchanged; remains unchanged
Correct Answer:
Verified
Q46: A jeweler cut prices in his store
Q47: If the short-run elasticity of demand for
Q48: When the price of ulcer medication increased
Q49: If the demand for a good is
Q50: Identify the correct statement about the price
Q52: A subsidy to wheat farmers decreases the
Q53: If the demand for a good is
Q54: Graph A below shows an elastic demand
Q55: The table below shows the price elasticity
Q56: The long-run demand curve for wheat is
Unlock this Answer For Free Now!
View this answer and more for free by performing one of the following actions

Scan the QR code to install the App and get 2 free unlocks

Unlock quizzes for free by uploading documents