The figure below shows the change in the quantity of bicycles produced per week due to changes in the number of workers employed per week. Based on the figure, the marginal product of the second worker is _____.Figure 6-1 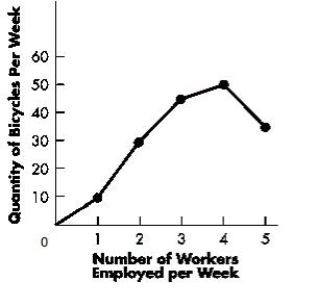
A) 10 bicycles
B) 15 bicycles
C) 20 bicycles
D) 30 bicycles
E) 25 bicycles
Correct Answer:
Verified
Q52: Which of the following is most likely
Q53: The table below shows the total number
Q54: Which of the following would be considered
Q55: The figure below shows how the quantity
Q56: The table below shows how a factory's
Q58: The production function describes:
A)the relationship between the
Q59: Which of the following is a short
Q60: The long run:
A)is a period long enough
Q61: The figure below shows the various cost
Q62: The figure below shows the various cost
Unlock this Answer For Free Now!
View this answer and more for free by performing one of the following actions

Scan the QR code to install the App and get 2 free unlocks

Unlock quizzes for free by uploading documents