The figure below shows how the quantity of bicycles produced per week varies with the number of workers employed per week. Based on the figure, the marginal product of the fifth worker hired each week is _____.Figure 6-1 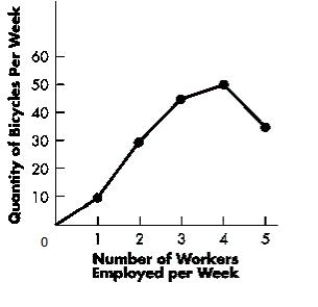
A) zero bicycles
B) 10 bicycles
C) 15 bicycles
D) −15 bicycles
E) -20 bicycles
Correct Answer:
Verified
Q45: The table below shows how a factory's
Q46: Fixed costs are costs:
A)that do not vary
Q47: The short run is:
A)a period in which
Q48: The figure below shows how the quantity
Q49: A firm can produce 840 gallons of
Q51: The marginal product of capital:
A)is equal to
Q52: Which of the following is most likely
Q53: The table below shows the total number
Q54: Which of the following would be considered
Q55: The figure below shows how the quantity
Unlock this Answer For Free Now!
View this answer and more for free by performing one of the following actions

Scan the QR code to install the App and get 2 free unlocks

Unlock quizzes for free by uploading documents