The figure below shows the cost curves faced by an industry. Based on the figure, B represents _____.Figure 6-3 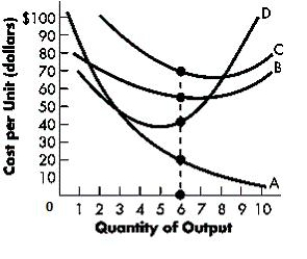
A) the total fixed cost curve
B) the marginal cost curve
C) the average fixed cost curve
D) the average fixed cost curve.
E) the average variable cost curve
Correct Answer:
Verified
Q62: The figure below shows the various cost
Q63: Total variable costs:
A)are the costs of short-run
Q64: If average fixed cost and average variable
Q65: If Randy's fixed cost totals $800 and
Q66: A firm produces 200 units of output
Q68: The table below shows the amount of
Q69: The per-unit cost of total output is
Q70: The figure below shows the relationship between
Q71: The table below shows how total cost
Q72: If average total cost is $40 and
Unlock this Answer For Free Now!
View this answer and more for free by performing one of the following actions

Scan the QR code to install the App and get 2 free unlocks

Unlock quizzes for free by uploading documents