The figure below shows the change in the quantity of output produced along with the change in cost per unit. Based on the figure, D represents _____.Figure 6-3 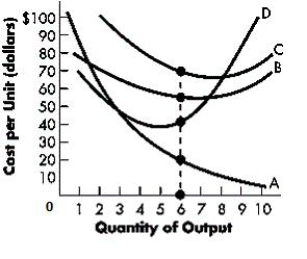
A) the total fixed cost curve
B) the marginal cost curve
C) the average fixed cost curv
D) the average total cost curve
E) the average variable cost curve
Correct Answer:
Verified
Q72: If average total cost is $40 and
Q73: The table below shows how total cost
Q74: The table below shows the amount of
Q75: A firm produces 1,000 units of output
Q76: If the average total cost of producing
Q78: The table below shows how total cost
Q79: The table below shows the amount of
Q80: The table below shows how total cost
Q81: If a firm's average total cost falls
Q82: From the perspective of a firm, is
Unlock this Answer For Free Now!
View this answer and more for free by performing one of the following actions

Scan the QR code to install the App and get 2 free unlocks

Unlock quizzes for free by uploading documents