The figure below shows the various cost curves. Based on the figure, the area BEQO at OQ output level represents _____.Figure 6-4 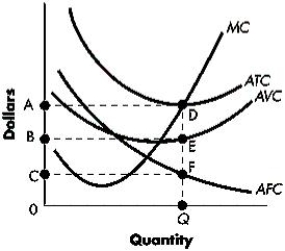
A) total fixed cost
B) total variable cost
C) average fixed cost
D) average total cost
E) marginal cost
Correct Answer:
Verified
Q78: The table below shows how total cost
Q79: The table below shows the amount of
Q80: The table below shows how total cost
Q81: If a firm's average total cost falls
Q82: From the perspective of a firm, is
Q84: Explain the cost advantage of a firm
Q86: When there are diseconomies of scale in
Q87: The table below describes the technology used
Q181: What is the law of diminishing marginal
Q195: How short is the short-run production period?
Unlock this Answer For Free Now!
View this answer and more for free by performing one of the following actions

Scan the QR code to install the App and get 2 free unlocks

Unlock quizzes for free by uploading documents