The figure below shows the long-run average cost curve of a firm. Based on the figure, the region y shows _____.Figure 6-5 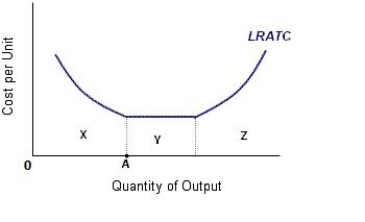
A) the range of output over which the firm attains diseconomies of scale
B) the range of output over which the firm attains constant returns to scale
C) the range of output over which the firm attains minimum efficient scale
D) the range of output over which the firm attains economies of scale
E) the range of output over which the firm attains zero economic profit
Correct Answer:
Verified
Q86: When there are diseconomies of scale in
Q87: The table below describes the technology used
Q89: The figure below shows the long-run average
Q91: The figure below shows the long-run average
Q92: Constant returns to scale indicate that a
Q93: Explain why some costs are considered to
Q94: Where does the marginal cost curve intersect
Q95: Which of the following is true in
Q181: What is the law of diminishing marginal
Q195: How short is the short-run production period?
Unlock this Answer For Free Now!
View this answer and more for free by performing one of the following actions

Scan the QR code to install the App and get 2 free unlocks

Unlock quizzes for free by uploading documents