Refer to Figure 7-1. Graphs A and B together demonstrate the effect that a change in market demand has on the demand curve faced by an individual firm. In this case, the firm is:Figure 7-1 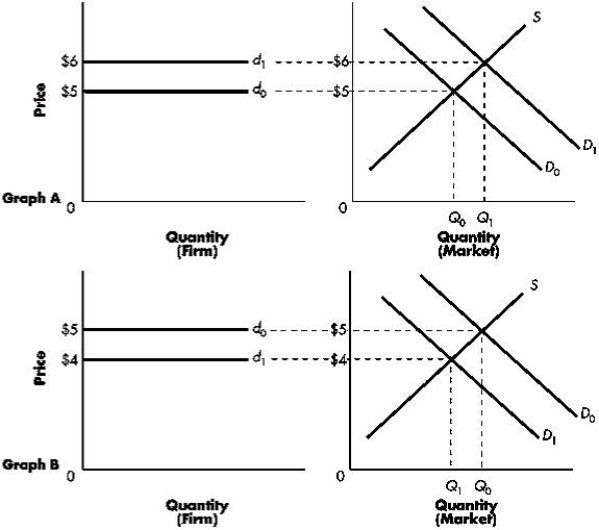
A) producing a differentiated product from other firms in the market.
B) quite large relative to the market output as a whole.
C) a price taker.
D) technologically more advance than other firms in the market.
E) the controller of price in the market.
Correct Answer:
Verified
Q46: The marginal revenue for a perfectly competitive
Q47: Figure 7-4 shows the relationship among the
Q48: If a profit-maximizing firm finds that price
Q49: Table 7-1 shows revenue and cost data
Q50: If the market demand curve in a
Q52: Marginal revenue is:
A)the additional cost incurred from
Q53: In the short run, a perfectly competitive
Q54: A perfectly competitive firm looking to maximize
Q55: Figure 7-3 shows the demand, marginal cost,
Q56: A firm sells grapefruit in a perfectly
Unlock this Answer For Free Now!
View this answer and more for free by performing one of the following actions

Scan the QR code to install the App and get 2 free unlocks

Unlock quizzes for free by uploading documents