Refer to Figure 7-1. In Graph B, the market demand has decreased from d0 to d1 and, as a result, _____.Figure 7-1 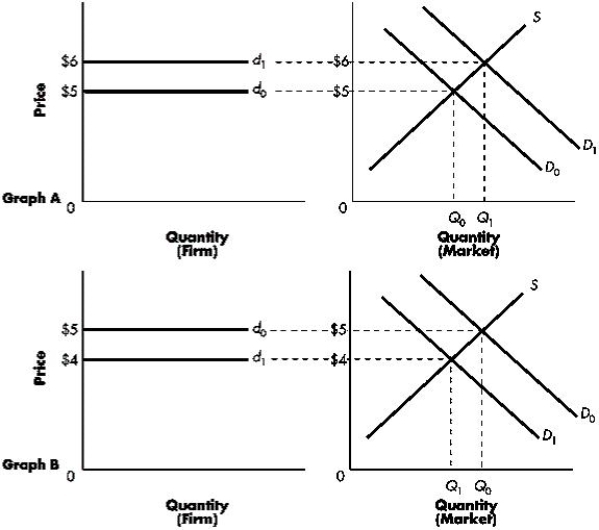
A) both the market price and the price of the price-taking firm have increased
B) both the market price and the price of the price-taking firm have fallen to $4
C) the quantity of goods transacted in the market has fallen
D) the firm will be unable to sell any of its output at the new equilibrium price
E) some firms will sell their output at a higher price than others
Correct Answer:
Verified
Q37: A perfectly competitive firm has no influence
Q38: Which of the following is true of
Q39: A perfectly competitive firm faces a demand
Q40: Figure 7-1 shows the market demand curve
Q41: If the market demand curve in a
Q43: Figure 7-2 shows the relationship among the
Q44: A price-taking firm will tend to expand
Q45: If a profit-maximizing firm finds that price
Q46: The marginal revenue for a perfectly competitive
Q47: Figure 7-4 shows the relationship among the
Unlock this Answer For Free Now!
View this answer and more for free by performing one of the following actions

Scan the QR code to install the App and get 2 free unlocks

Unlock quizzes for free by uploading documents