Figure 7-4 shows the relationship between the various costs of a perfectly competitive firm. In the figure, when the market price equals $105 and the firm sells 675 units of output, the firm:Figure 7-4 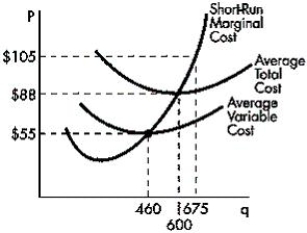
A) is earning a normal profit.
B) is earning positive economic profit.
C) is experiencing a loss, but should continue operating temporarily because business conditions may improve.
D) is experiencing a loss and should shut down.
E) should sell more units of its output to earn higher prices.
Correct Answer:
Verified
Q65: Figure 7-6 shows a firm in a
Q66: A profit-maximizing, perfectly competitive firm would never
Q67: Figure 7-8 shows a firm in a
Q68: Which of the following statements is true
Q69: Which of the following is true of
Q71: Which of the following is a characteristic
Q72: If a perfectly competitive industry is neither
Q73: Under perfect competition, in long-run equilibrium, _.
A)price
Q74: A firm receives $10 per unit at
Q75: Figure 7-5 shows cost and revenue curves
Unlock this Answer For Free Now!
View this answer and more for free by performing one of the following actions

Scan the QR code to install the App and get 2 free unlocks

Unlock quizzes for free by uploading documents