The figure below shows the revenue and cost curves for a profit-maximizing monopolist. Based on the figure, the monopolist will produce ______.Figure 8-1: 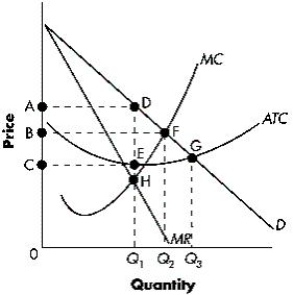
A) Q1 units of output
B) Q2 units of output
C) Q3 units of output
D) between Q1 and Q2 units of output
E) between Q2 and Q3 units of output
Correct Answer:
Verified
Q36: A natural gas monopoly currently sells 100
Q37: A monopoly is characterized by:
A)a large number
Q38: Which of the following is true for
Q39: The table below shows the quantity produced
Q40: For price discrimination to work, the person
Q42: Show Stoppers is a monopoly provider of
Q43: A monopoly firm is producing at the
Q44: A monopolist can sell 7 units per
Q45: A monopolist will shut down in the
Q46: At a given output level, a monopolist
Unlock this Answer For Free Now!
View this answer and more for free by performing one of the following actions

Scan the QR code to install the App and get 2 free unlocks

Unlock quizzes for free by uploading documents