The figure below shows the revenue and cost curves of a profit-maximizing monopolist. Based on the figure, the total cost of producing the profit-maximizing level of output is indicated by the region ______.Figure 8-1: 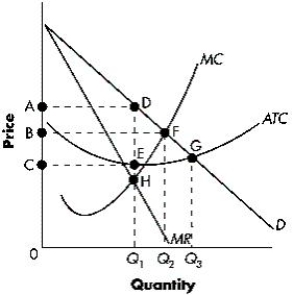
A) 0CEQ1
B) 0BFQ2
C) 0ADQ1
D) CADE
E) BADF
Correct Answer:
Verified
Q53: The figure below shows the revenue and
Q54: The figure below shows the revenue and
Q55: The figure below shows the revenue and
Q56: A monopolist can sell 20 units a
Q57: At a given level of output, a
Q59: A monopolist will operate at the quantity
Q60: If a profit-maximizing monopolist is currently operating
Q61: The patent system is intended to:
A)prevent natural
Q62: There are two tables below. The first
Q63: Welfare loss occurs in a monopoly because:
A)marginal
Unlock this Answer For Free Now!
View this answer and more for free by performing one of the following actions

Scan the QR code to install the App and get 2 free unlocks

Unlock quizzes for free by uploading documents