The following graphs show two firms operating in a monopolistically competitive market. In Graph B, a loss-minimizing firm will experience a _____ at an output quantity _____.Figure 9.2: 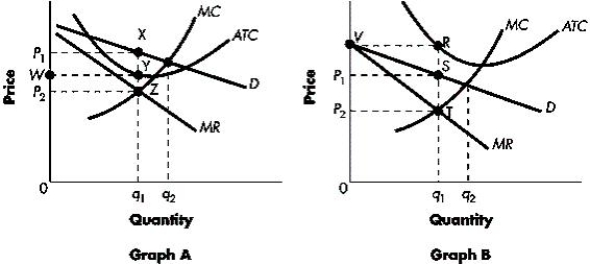
A) minimum loss; of q1
B) minimum loss; of q2
C) profit; of q1
D) profit; of q2
E) profit; between q1 and q2
Correct Answer:
Verified
Q41: Monopolistic and perfect competition are alike in
Q42: The following graphs show two firms operating
Q43: The demand curve for a monopolistically competitive
Q44: The following graphs show two firms operating
Q45: The following graph shows a firm producing
Q47: Long-run equilibrium under monopolistic competition is similar
Q48: The firm will charge a price of
Q49: In the long run, a monopolistically competitive
Q50: In a monopolistically competitive market structure, the
Q51: The following graphs show two firms operating
Unlock this Answer For Free Now!
View this answer and more for free by performing one of the following actions

Scan the QR code to install the App and get 2 free unlocks

Unlock quizzes for free by uploading documents