Figure 13-3 shows the relationship between real GDP and the price level in an economy. In the figure, _____ represents long-run aggregate supply?Figure 13-3 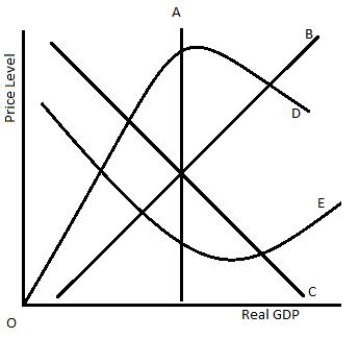
A) curve A
B) curve B
C) curve C
D) curve D
E) curve E
Correct Answer:
Verified
Q42: Which of the following would be true
Q43: Figure 13-2 shows shifts in the aggregate
Q44: The short-run aggregate supply curve:
A)represents a fixed
Q45: Along the long-run aggregate supply curve, the
Q46: Which of the following would be true
Q48: The short-run aggregate supply curve is:
A)typically vertical.
B)typically
Q49: If the stock market of a country
Q50: Figure 13-3 shows the relationship between real
Q51: Which of the following statements is true?
A)The
Q52: Which of the following increases U.S. aggregate
Unlock this Answer For Free Now!
View this answer and more for free by performing one of the following actions

Scan the QR code to install the App and get 2 free unlocks

Unlock quizzes for free by uploading documents