The figure below shows the aggregate demand curve along with both the long-run and the short-run aggregate supply curves in an economy. The economy can move from point E0 to E1 through:Figure 14-1 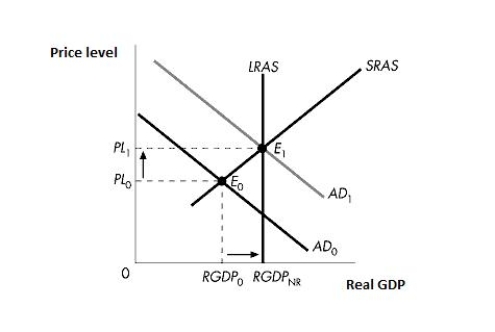
A) a decrease in taxes and an increase in government purchases, other things constant.
B) an increase in taxes and government purchases, other things constant
C) a decrease in taxes and government purchases, other things constant.
D) an increase in taxes and a decrease in government purchases, other things constant.
E) an increase in taxes and an increase in the discount rate, other things constant.
Correct Answer:
Verified
Q38: Suppose a flat tax plan allows individuals
Q39: Which of the following is not an
Q40: Suppose a flat tax plan allows individuals
Q41: A decrease in government purchases, other things
Q42: A reduction in taxes, combined with an
Q44: Suppose the federal government buys $10 million
Q45: Expansionary fiscal policy will result in _
Q46: An increase in taxes in an economy,
Q47: If the government wants to decrease the
Q48: An expansionary fiscal policy consists of:
A)increased taxes
Unlock this Answer For Free Now!
View this answer and more for free by performing one of the following actions

Scan the QR code to install the App and get 2 free unlocks

Unlock quizzes for free by uploading documents