The figure below shows the aggregate demand curve, the long-run aggregate supply curve, and the short-run aggregate supply curve in an economy. Based on the figure, if an increase in aggregate demand from AD0 to AD1 is unanticipated, the economy will move from point A to point _____in the short run.Figure-1 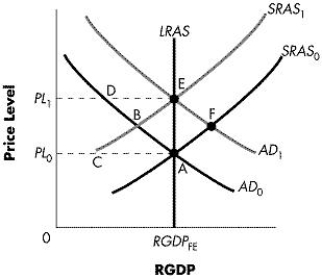
A) A
B) B
C) E
D) F
E) D
Correct Answer:
Verified
Q42: The rational expectations theory implies that an
Q43: Believers in the hypothesis of rational expectations
Q44: With rational expectations, a correctly anticipated policy
Q45: According to the Taylor rule, the Fed
Q46: Critics of the rational expectations theory believe
Q48: According to the Taylor rule, if real
Q49: According to the rational expectations view, the
Q50: It is difficult for policy makers to
Q51: A negative supply shock may lead to:
A)an
Q52: Which of the following is true?
A)Rational expectation
Unlock this Answer For Free Now!
View this answer and more for free by performing one of the following actions

Scan the QR code to install the App and get 2 free unlocks

Unlock quizzes for free by uploading documents