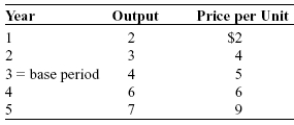
Use the following to answer questions :
Table: Price and Output Data 
-(Table: Price and Output Data) Look at the table Price and Output Data. Between years 2 and 3, real GDP increased by:
A) 10%.
B) 20%.
C) 30%.
D) 33%.
Correct Answer:
Verified
Q291: Use the following to answer questions :
Table:
Q292: The producer price index is often regarded
Q293: Use the following to answer questions :
Table:
Q294: Use the following to answer questions :
Table:
Q295: Use the following to answer questions :
Table:
Q297: Use the following to answer questions :
Table:
Q298: Use the following to answer questions :
Table:
Q299: Use the following to answer questions :
Table:
Q300: Payments to Social Security recipients are indexed
Q301: A household is a person or group
Unlock this Answer For Free Now!
View this answer and more for free by performing one of the following actions

Scan the QR code to install the App and get 2 free unlocks

Unlock quizzes for free by uploading documents