Use the following to answer questions :
Figure: Nations A and B 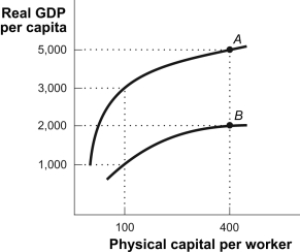
-(Figure: Nations A and
B) Look at the figure Nations A and B. Suppose that in 1960 each nation had $100 of physical capital for each worker and in 2010 each nation had $400 of physical capital per worker. Clearly in both 1960 and in 2010 nation A was producing more real output per capita with the same amount of physical capital per worker. What could explain the difference in these aggregate production functions?
Correct Answer:
Verified
View Answer
Unlock this answer now
Get Access to more Verified Answers free of charge
Q291: In 2010, the median U.S. household income
Q292: Fifty years ago East Asia, Latin America,
Q293: If real GDP in country A is
Q294: Education's effect on productivity:
A)is believed to be
Q295: Diminishing returns to physical capital suggests that:
A)at
Q297: In the past 30 years, both China
Q298: If the population and GDP increase by
Q299: Historically, development of a new technology often:
A)results
Q300: The value of real GDP divided by
Q301: The convergence hypothesis:
A)apparently applies only to wealthy
Unlock this Answer For Free Now!
View this answer and more for free by performing one of the following actions

Scan the QR code to install the App and get 2 free unlocks

Unlock quizzes for free by uploading documents