Use the following to answer questions :
Figure: Shifts in Demand and Supply II 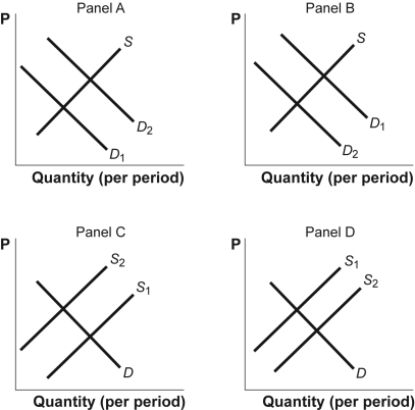
-(Figure: Shifts in Demand and Supply II) Look at the figure Shifts in Demand and Supply II. The graph shows how supply and demand might shift in response to specific events. Suppose a drought destroys one-third of the nation's peanut crop. Which panel BEST describes how this will affect the market for peanuts?
A) panel A
B) panel B
C) panel C
D) panel D
Correct Answer:
Verified
Q124: Use the following to answer questions:
Figure: Shifts
Q125: Use the following to answer questions :
Figure:
Q126: Use the following to answer questions:
Figure: Shifts
Q127: Use the following to answer questions :
Figure:
Q128: Use the following to answer questions :
Figure:
Q130: Use the following to answer questions :
Figure:
Q131: Use the following to answer questions :
Figure:
Q132: Use the following to answer questions:
Figure: Shifts
Q133: Which of the following will raise the
Q134: Use the following to answer questions:
Figure: Shifts
Unlock this Answer For Free Now!
View this answer and more for free by performing one of the following actions

Scan the QR code to install the App and get 2 free unlocks

Unlock quizzes for free by uploading documents