Use the following to answer questions :
Figure: Consumption of Pizza and Tacos 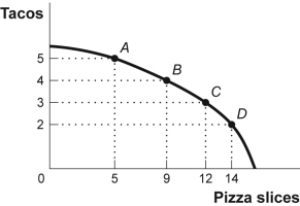
-(Figure: Consumption of Pizza and Tacos) Look at the figure Consumption of Pizza and Tacos. The figure shows the number of tacos and pizza slices Matt can eat in a day. The best estimate of the slope between point A and point B is -4.
Correct Answer:
Verified
Q45: A linear curve has the same slope
Q46: A scatter diagram shows:
A)how far apart dependent
Q49: The owner of the Dismal Philosopher,one of
Q50: The fact that two variables always move
Q51: In looking at a chart of the
Q62: Use the following to answer questions :
Figure:
Q65: Use the following to answer questions:
Figure: Unemployment
Q69: The scaling of the axes of a
Q70: In a time-series graph, large changes can
Q341: A town hires more police officers and
Unlock this Answer For Free Now!
View this answer and more for free by performing one of the following actions

Scan the QR code to install the App and get 2 free unlocks

Unlock quizzes for free by uploading documents