Use the following to answer question
Figure: Interpreting Aggregate Shifts 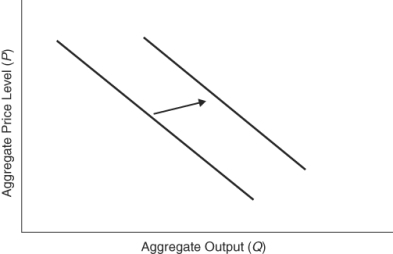
-(Figure: Interpreting Aggregate Shifts) The graph shows:
A) a decrease in aggregate quantity supplied.
B) an increase in aggregate quantity supplied.
C) a decrease in aggregate demand.
D) an increase in aggregate demand.
Correct Answer:
Verified
Q2: If the money supply is fixed and
Q76: If oil prices decrease,the short-run aggregate supply
Q77: Use the following to answer questions
Figure:
Q79: Which of the following factors causes a
Q81: If businesses expect to start earning more
Q95: If Europe has a large increase in
Q99: Government spending on Social Security:
A) has no
Q100: If the national incomes of foreign countries
Q246: _ taxes and _ interest rates in
Q277: If both consumers and businesses are pessimistic
Unlock this Answer For Free Now!
View this answer and more for free by performing one of the following actions

Scan the QR code to install the App and get 2 free unlocks

Unlock quizzes for free by uploading documents