Use the following to answer question
Figure: Interpreting Demand Curves 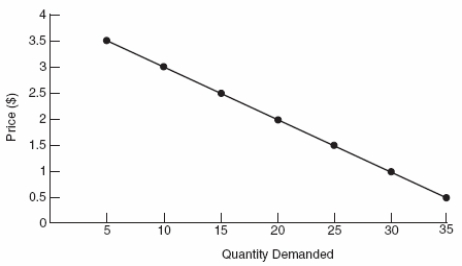
-(Figure: Interpreting Demand Curves) In the demand curve shown,an increase in price from $1 to $2 will:
A) cause quantity demanded to rise from 20 to 30 units.
B) cause quantity demanded to fall from 30 to 20 units.
C) have no impact on sales.
D) make buyers mad.
Correct Answer:
Verified
Q45: The demand for gasoline is rising.Which of
Q46: Use the following to answer questions
Figure:
Q47: If the demand for iPhones rises as
Q48: Use the following to answer questions
Figure:
Q50: Which of the following is an example
Q51: Use the following to answer questions
Figure:
Q52: If consumers believe that an item will
Q53: Which of the following should shift the
Q71: A shift in the demand curve is
Q86: Bus tickets are often considered _ goods
Unlock this Answer For Free Now!
View this answer and more for free by performing one of the following actions

Scan the QR code to install the App and get 2 free unlocks

Unlock quizzes for free by uploading documents