Which of the following graphs concerning hamburgers indicates an increase in the quantity demanded of hamburgers?
A) 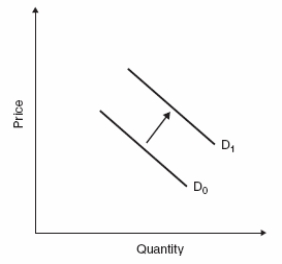
B) 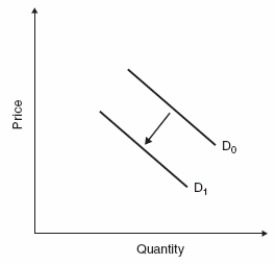
C) 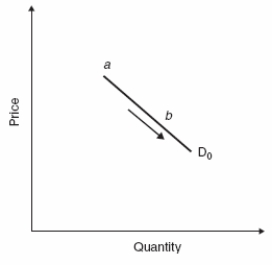
D) 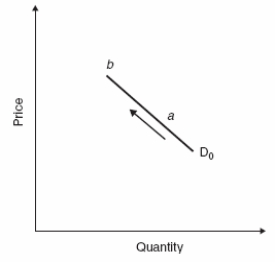
Correct Answer:
Verified
Q67: All of the following cause a shift
Q68: Which of the following would be considered
Q69: Use the following to answer question
Figure:
Q70: Which of the following would increase demand
Q71: Which of the following would cause a
Q73: Use the following to answer question
Figure:
Q74: Suppose that you discover that,ceteris paribus,when the
Q75: An increase in the price of ice
Q77: If bagels and doughnuts are substitute goods,then
Q111: Other factors held constant, as the price
Unlock this Answer For Free Now!
View this answer and more for free by performing one of the following actions

Scan the QR code to install the App and get 2 free unlocks

Unlock quizzes for free by uploading documents