Use the following to answer questions
Figure: Interpreting a Market Graph 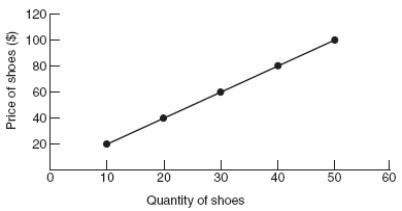
-(Figure: Interpreting a Market Graph) The graph represents:
A) willingness-to-pay.
B) the price system.
C) the law of supply.
D) the law of demand.
Correct Answer:
Verified
Q106: If the number of tomato growers in
Q107: Which of the following events would shift
Q108: Which of the following would shift the
Q109: Which of the following will cause an
Q110: Use the following to answer questions
Figure:
Q112: Use the following to answer questions
Figure:
Q113: An increase in the cost of coffee
Q114: Use the following to answer question
Figure:
Q115: Which of the following will NOT lead
Q141: Electricity is essential in the production of
Unlock this Answer For Free Now!
View this answer and more for free by performing one of the following actions

Scan the QR code to install the App and get 2 free unlocks

Unlock quizzes for free by uploading documents