Figure: Laffer Curve 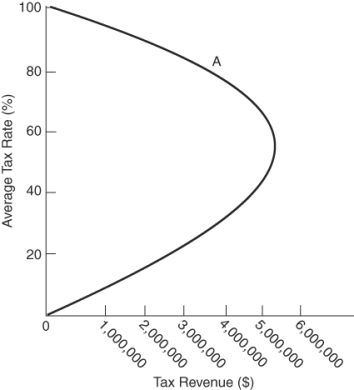 (Figure: Laffer Curve) The graph shows a hypothetical Laffer curve.If the tax rate is 80%:
A) the government should reduce the rate to about 50% to maximize tax revenue.
B) the tax rate should be increased to 100% (all income taken in taxes) to maximize tax collection.
C) the tax rate is at its optimal level.
D) the tax rate should be reduced to zero to maximize tax revenue.
Correct Answer:
Verified
Q58: Reducing tax rates can _ aggregate demand
Q90: Figure: Laffer Curve 2 Q91: Which of the following statements is TRUE? Q92: The Laffer curve demonstrates that:![]()
A)
A) above some
Unlock this Answer For Free Now!
View this answer and more for free by performing one of the following actions

Scan the QR code to install the App and get 2 free unlocks

Unlock quizzes for free by uploading documents