(Figure: Understanding Economic Shifts) 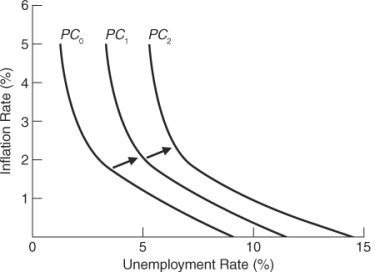 The graph depicts:
A) an expansion.
B) dropping unemployment rates.
C) stagflation.
D) deflation.
Correct Answer:
Verified
Q46: Suppose policymakers want to keep the unemployment
Q56: When the expected rate of inflation increases,
Q91: Which of the following does NOT describe
Q93: Use the following to answer questions
Figure:
Q94: Use the following to answer questions
Figure:
Q97: Unanticipated inflation results in:
A) real wages increasing.
B)
Q100: Which of the following events will NOT
Q140: Adaptive expectations theory describes the use of
Q167: Accelerating inflation causes nominal wages to rise,
Q215: The Phillips curve will shift when
A) the
Unlock this Answer For Free Now!
View this answer and more for free by performing one of the following actions

Scan the QR code to install the App and get 2 free unlocks

Unlock quizzes for free by uploading documents