Use the following to answer question
Figure: Graph Interpretation 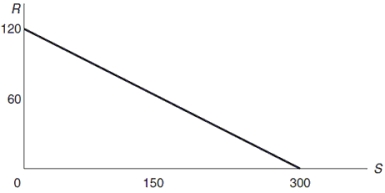
-(Figure: Graph Interpretation)In the graph,a negative relationship is depicted with a slope of -0.4.
Correct Answer:
Verified
Q64: In the equation Y = b -
Q66: Correlation between two variables is not enough
Q113: If variable X rises as variable Q
Q179: Simple graphs never provide information about the
Q185: Titles, labels for axes, and a statement
Q188: A pie chart is useful for business
Q191: Linear relationships show the same slope between
Q209: Open access to information is necessary in
Q237: If two variables are correlated with one
Q251: Use the following to answer questions
Figure: Sales
Unlock this Answer For Free Now!
View this answer and more for free by performing one of the following actions

Scan the QR code to install the App and get 2 free unlocks

Unlock quizzes for free by uploading documents