Which of the graphs in Figure 20-1 illustrates the behavior of a total variable cost?
A) Graph 2
B) Graph 3
C) Graph 4
D) Graph 1 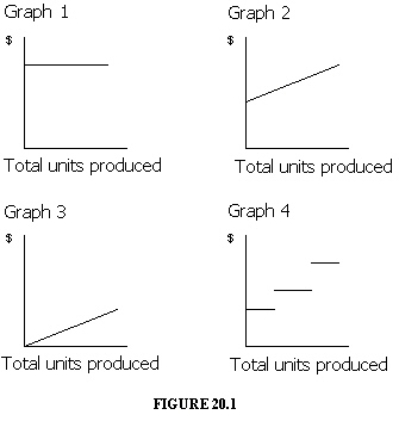
Correct Answer:
Verified
Q62: Which of the following is an example
Q64: Which of the following costs is a
Q71: Which of the following activity bases would
Q73: Which of the following describes the behavior
Q76: Which of the following activity bases would
Q77: Which of the graphs in Figure 20-1
Q79: Which of the following is NOT an
Q80: Which of the following describes the behavior
Q80: Most operating decisions of management focus on
Q80: Which of the graphs in Figure 20-1
Unlock this Answer For Free Now!
View this answer and more for free by performing one of the following actions

Scan the QR code to install the App and get 2 free unlocks

Unlock quizzes for free by uploading documents