The cost graphs in the illustration below shows various types of cost behaviors.
For each of the following costs, identify the cost graph that best describes its cost behavior as the number of units produced and sold increases:
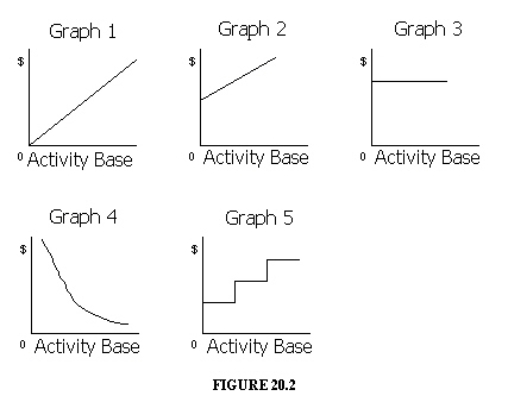

Correct Answer:
Verified
Q202: For the coming year, River Company estimates
Q205: Kissimmee Paint Co. reported the following data
Q206: A company with a break-even point at
Q206: Currently, the unit selling price is $50,
Q207: The following data are available from the
Q208: A company has a margin of safety
Q212: Perfect Stampers makes and sells aftermarket hub
Q213: For the current year ending April 30,
Q215: The following is a list of various
Q221: Define operating leverage. Explain the relationship between
Unlock this Answer For Free Now!
View this answer and more for free by performing one of the following actions

Scan the QR code to install the App and get 2 free unlocks

Unlock quizzes for free by uploading documents