Figure: Allocating Goods under Price Ceilings 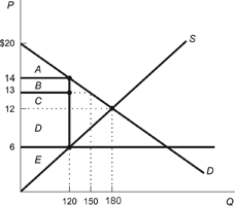
Refer to the figure. Using the information provided in the graph, answer the following questions:
a. If the goods were allocated only to those users who had the highest-value uses, find the total dollar amount of consumer surplus.
b. If the goods are allocated randomly between the high-value uses and the low-value uses, then what is the average value of the good?
c. If goods are allocated randomly, what is the total dollar amount of consumer surplus?
Correct Answer:
Verified
View Answer
Unlock this answer now
Get Access to more Verified Answers free of charge
Q299: Rent controls create large shortages in the
Q300: When prices are not allowed to rise,
Q301: In the presence of a price floor,
Q302: Assume that a market is defined by
Q303: Rent controls are typically implemented as a
Q305: A market's demand and supply curves are
Q306: The minimum wage is an example of
Q307: Using a supply and demand diagram as
Q308: Illustrate on a supply and demand diagram
Q309: Minimum wage laws are an example of
Unlock this Answer For Free Now!
View this answer and more for free by performing one of the following actions

Scan the QR code to install the App and get 2 free unlocks

Unlock quizzes for free by uploading documents