Figure: Price Changes 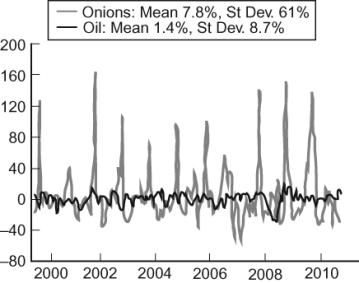 The figure (from Global Financial Data, EIA) illustrates in percentage terms how the price of onions (in gray) and crude oil (in black) fluctuate over time. The price of onions clearly fluctuates more than oil. In 1958, the United States Congress banned future markets on onions. How does this historical fact explain the difference in deviation between oil and onions?
A) The ban prevented analysts from buying and selling based on the price of onions' current supply and demand.
B) The ban encouraged speculation on the onion, causing its price to fluctuate widely as different bubbles grew and popped.
C) The ban destroyed any incentive for market participants to understand the onion industry.
D) The ban forced market participants to buy and sell based solely on current supply and demand.
Correct Answer:
Verified
Q152: On June 30, 2011, the price of
Q153: Tyler buys a futures contract from Alex
Q154: Use the following to answer question 154:
Figure:
Q155: A futures contract is:
A) a contract to
Q156: If farmers are concerned about the price
Q158: Currency futures have the price of 10,000
Q159: Legalizing insider trading may have some advantages
Q160: Suppose that everyone believes war is about
Q161: Speculators who think that a war in
Q162: Futures markets are often good predictors of
Unlock this Answer For Free Now!
View this answer and more for free by performing one of the following actions

Scan the QR code to install the App and get 2 free unlocks

Unlock quizzes for free by uploading documents