Figure: Demand 1 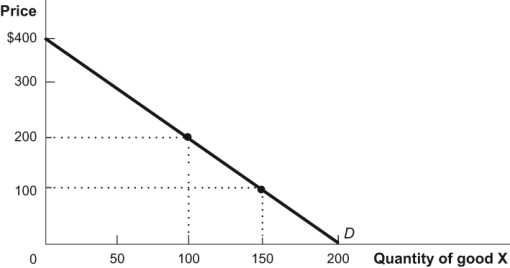 In the diagram, what is the elasticity of demand between a price of $100 and $200? Use the midpoint method of calculation to find your answer.
A) -1.8.
B) -0.9.
C) -0.6.
D) -0.2.
Correct Answer:
Verified
Q83: If the demand for a good is
Q84: If the price of electronic readers falls
Q85: Suppose the price of a good rises
Q86: In the elastic portion of a linear
Q87: The elasticity of demand is always negative
Q89: If the price elasticity of demand is
Q90: Suppose that along a given demand curve,
Q91: If a 4 percent increase in the
Q92: Walter provides lawn-cutting services and notices that
Q93: Use the midpoint method to answer this
Unlock this Answer For Free Now!
View this answer and more for free by performing one of the following actions

Scan the QR code to install the App and get 2 free unlocks

Unlock quizzes for free by uploading documents