Use the following to answer questions:
Figure: Price and Quantity 2 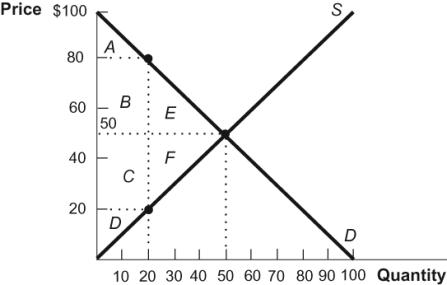
-(Figure: Price and Quantity 2) At a cost of $20 per unit in the diagram, the demanders whose wants are satisfied are represented by the section of the demand curve between a price of:
A) $100 and $80.
B) $100 and $50.
C) $0 and $100.
D) $20 and $80.
Correct Answer:
Verified
Q58: Imagine a free market in which quantity
Q59: How is a class in which students
Q60: When there is an excess supply in
Q61: Why is consuming a quantity above equilibrium
Q62: In a free market when there are
Q64: When producers produce more than the equilibrium
Q65: Use the following to answer questions:
Figure: Demand
Q66: Figure: Basic Supply and Demand
M 
Q67: In a free market in which an
Q68: Use the following to answer questions:
Figure: Gains
Unlock this Answer For Free Now!
View this answer and more for free by performing one of the following actions

Scan the QR code to install the App and get 2 free unlocks

Unlock quizzes for free by uploading documents