Use the following to answer questions:
Figure: Demand, Supply Shifts 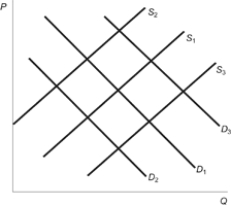
-(Figure: Demand, Supply Shifts) In the figure, the initial demand curve is D1 and the initial supply curve is S1. Suppose this depicts the market for corn. How does the market change when flooding in Iowa destroys a significant amount of the corn crop.
A) S1 will shift to S2.
B) D1 will shift to D2.
C) S1 will shift to S3.
D) There will be no change in supply or demand in the market for corn.
Correct Answer:
Verified
Q105: Which of the following would NOT lead
Q106: An increase in supply and a decrease
Q107: Which of the following might explain why
Q108: Figure: Demand-Driven Price Change Q109: After adjusting for inflation, a comparison of Q111: An increase in demand and a decrease Q112: If hipsters decide that Pabst Blue Ribbon Q113: Which of the following would increase the Q114: In markets for manufactured goods, a new Q115: If the government institutes a tax on![]()
Unlock this Answer For Free Now!
View this answer and more for free by performing one of the following actions

Scan the QR code to install the App and get 2 free unlocks

Unlock quizzes for free by uploading documents