Figure: Supply-Driven Price Change 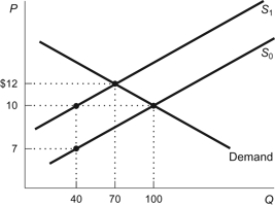 Refer to the figure. When the supply curve shifts from S0 to S1, the equilibrium price rises to:
A) $12 and the equilibrium quantity falls to 70.
B) $10 and the equilibrium quantity falls to 100.
C) $12 and the equilibrium quantity falls to 40.
D) $10 and the equilibrium quantity falls to 70.
Correct Answer:
Verified
Q83: An early frost in the vineyards of
Q99: Use the following to answer questions:
Figure: Price
Q100: Use the following to answer questions:
Figure: Market
Q102: Use the following to answer questions:
Figure: Demand,
Q103: Immediately after a hurricane, it is likely
Q105: Which of the following would NOT lead
Q106: An increase in supply and a decrease
Q107: Which of the following might explain why
Q108: Figure: Demand-Driven Price Change Q109: After adjusting for inflation, a comparison of![]()
Unlock this Answer For Free Now!
View this answer and more for free by performing one of the following actions

Scan the QR code to install the App and get 2 free unlocks

Unlock quizzes for free by uploading documents