Figure: Demand Shift 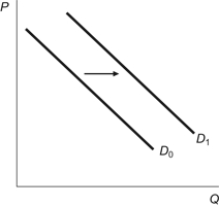 Which of the following could explain the figure?
A) Consumer income increases in the market for a normal good.
B) Consumer income falls in the market for a normal good.
C) Consumer income rises in the market for an inferior good.
D) Consumer income remains the same and the price of the good falls.
Correct Answer:
Verified
Q66: The average age in the United States
Q67: Figure: Demand Shift Q68: A decrease in income causes demand for Q69: Mario buys eight units of good X Q70: If the demand for good A increases Q72: Imagine that millions of refugees move out Q73: The quantity of DVDs that people plan Q74: If romaine lettuce and iceberg lettuce are Q75: Michael graduates from college and his income Q76: Coke and Pepsi are substitute soft drinks.![]()
Unlock this Answer For Free Now!
View this answer and more for free by performing one of the following actions

Scan the QR code to install the App and get 2 free unlocks

Unlock quizzes for free by uploading documents