Figure: Supply Shift 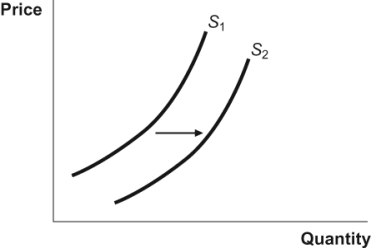 In the figure, a movement from S1 to S2 represents:
A) a decrease in supply.
B) an increase in supply.
C) a decrease in quantity supplied.
D) an increase in quantity supplied.
Correct Answer:
Verified
Q136: The supply curve for oil slopes upward
Q137: Recall the discussion in your textbook about
Q138: Why does supply slope up?
A) At higher
Q139: Suppose that Country X is a high-cost
Q140: Nigeria receives $53 of producer surplus from
Q142: Use the following to answer questions:
Figure: Producer
Q143: Figure: Supply Shift Q144: If prices rise, what happens to producer Q145: When the price of inputs increase: Q146: Figure: A Supply Curve ![]()
A) the![]()
Unlock this Answer For Free Now!
View this answer and more for free by performing one of the following actions

Scan the QR code to install the App and get 2 free unlocks

Unlock quizzes for free by uploading documents