Figure A: Supply Right Shift
Figure B: Supply Left Shift 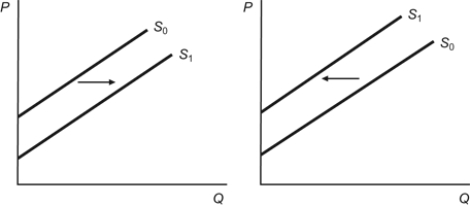
Refer to the two figures. Which statement is TRUE?
A) Figure A depicts the expectation that the future price will decrease.
B) Figure A depicts an increase in taxes.
C) Figure B depicts falling input prices.
D) Figure B depicts technological innovations.
Correct Answer:
Verified
Q167: An increase in a per unit production
Q168: If producers form expectations that copper prices
Q169: A subsidy is a:
A) reverse tax.
B) means
Q170: Firms are willing and able to sell
Q171: An increase in production costs at any
Q173: Use the following to answer questions:
Figure: Supply
Q174: Use the following to answer questions:
Figure: Supply
Q175: Use the following to answer questions:
Figure: Supply
Q176: Which of the following factors causes a
Q177: Suppose a new study predicts that the
Unlock this Answer For Free Now!
View this answer and more for free by performing one of the following actions

Scan the QR code to install the App and get 2 free unlocks

Unlock quizzes for free by uploading documents