Multiple Choice
Figure: Leisure 2 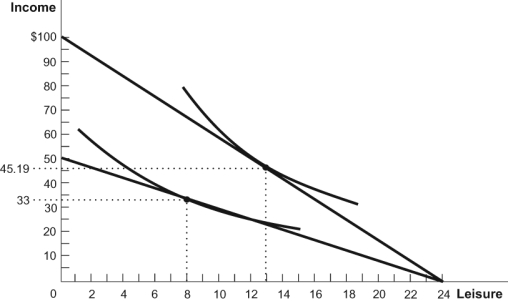 Refer to the figure. According to this diagram, which statement is FALSE?
A) At 13 hours of leisure and an income of $45.19, the worker earns a wage of $4.17 an hour.
B) The labor supply curve is downward sloping.
C) The substitution effect dominates the income effect.
D) This worker chooses to work more hours if paid higher wages.
Correct Answer:
Verified
Related Questions
Q90: If an individual's labor supply curve is
Q94: Which statement is TRUE?
A) The income effect
Q94: Which statement is TRUE?
A) The income effect
Unlock this Answer For Free Now!
View this answer and more for free by performing one of the following actions

Scan the QR code to install the App and get 2 free unlocks

Unlock quizzes for free by uploading documents