Figure: Monopoly Demand 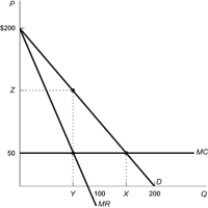
Refer to the figure. The demand curve for a profit-maximizing monopolist can be described by the equation Q = 200 - P. The marginal revenue curve for the monopolist is described by the equation MR = 200 - 2Q. The marginal cost associated with producing this good is constant at $50. Calculate the consumer surplus that consumers enjoy in this market.
Correct Answer:
Verified
View Answer
Unlock this answer now
Get Access to more Verified Answers free of charge
Q222: Using a well-labeled diagram, show:
a. the profit-maximizing
Q223: The National Football League (NFL) has long
Q224: Graphically depict a monopolist enjoying abnormal profits.
Q225: A monopolist has a demand function that
Q226: A monopolist's demand curve is described by
Q228: If you had the opportunity to operate
Q229: Graphically show that a monopolist facing a
Q230: From an economist's perspective, what are the
Q231: Figure: Monopoly Revenue Q232: What is the deadweight loss due to![]()
Unlock this Answer For Free Now!
View this answer and more for free by performing one of the following actions

Scan the QR code to install the App and get 2 free unlocks

Unlock quizzes for free by uploading documents