The table shows the TR and TC schedules for a competitive firm. Using your knowledge of cost and profit structures, fill in all the missing blanks.
Table: Cost Schedules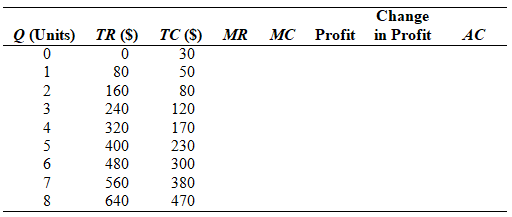
Correct Answer:
Verified
View Answer
Unlock this answer now
Get Access to more Verified Answers free of charge
Q198: If marginal cost is less than average
Q199: A competitive firm maximizes profits at the
Q200: At the profit-maximizing output level P =
Q201: The supply curve for oil slopes upward
Q202: Figure: Representative Firm Q204: If firms in a competitive market are Q205: Graphically illustrate the maximum profit of a Q206: Explain why a profit-maximizing firm in a Q207: Figure: Calculating Profits Q208: Draw a competitive firm in each of![]()
![]()
Unlock this Answer For Free Now!
View this answer and more for free by performing one of the following actions

Scan the QR code to install the App and get 2 free unlocks

Unlock quizzes for free by uploading documents