Use the following to answer questions :
Exhibit: Keynesian Cross and Loanable Funds
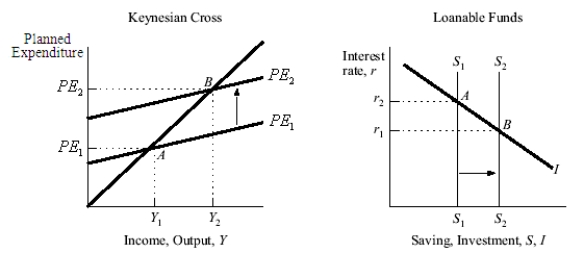
-(Exhibit: Keynesian Cross and Loanable Funds) Both graphs illustrate the inverse relationship between the equilibrium interest rate and the equilibrium level of income.The economy moves from equilibrium A to equilibrium B in the Loanable Funds diagram as a result of a(n) ______ that shifts saving.
A) increase in income
B) decrease in income
C) increase in the interest rate
D) decrease in the interest rate
Correct Answer:
Verified
Q44: When the LM curve is drawn, the
Q47: According to the theory of liquidity preference,
Q64: The theory of liquidity preference implies that,
Q69: According to the theory of liquidity preference,
Q74: A rise in government spending shifts the
Q77: Use the following to answer questions :
Exhibit:
Q78: The LM curve, in the usual case:
A)
Q79: According to the theory of liquidity preference,
Q84: If neither investment nor consumption depends on
Q91: If investment demand is infinite below some
Unlock this Answer For Free Now!
View this answer and more for free by performing one of the following actions

Scan the QR code to install the App and get 2 free unlocks

Unlock quizzes for free by uploading documents